Securing Digital Dominance
How Blackstone AI Built a High-Converting SEO Website and Social Media Engine for Eyonic Sdn Bhd
Executive Summary
Eyonic Sdn Bhd, a leading provider of comprehensive security solutions (CCTV, door access, alarm systems) in Malaysia, faced a critical bottleneck: their offline reputation was stellar, but their online presence was virtually non-existent. In an industry where trust and technical expertise are paramount, their outdated website and inactive social media channels were costing them valuable B2B and B2C leads.
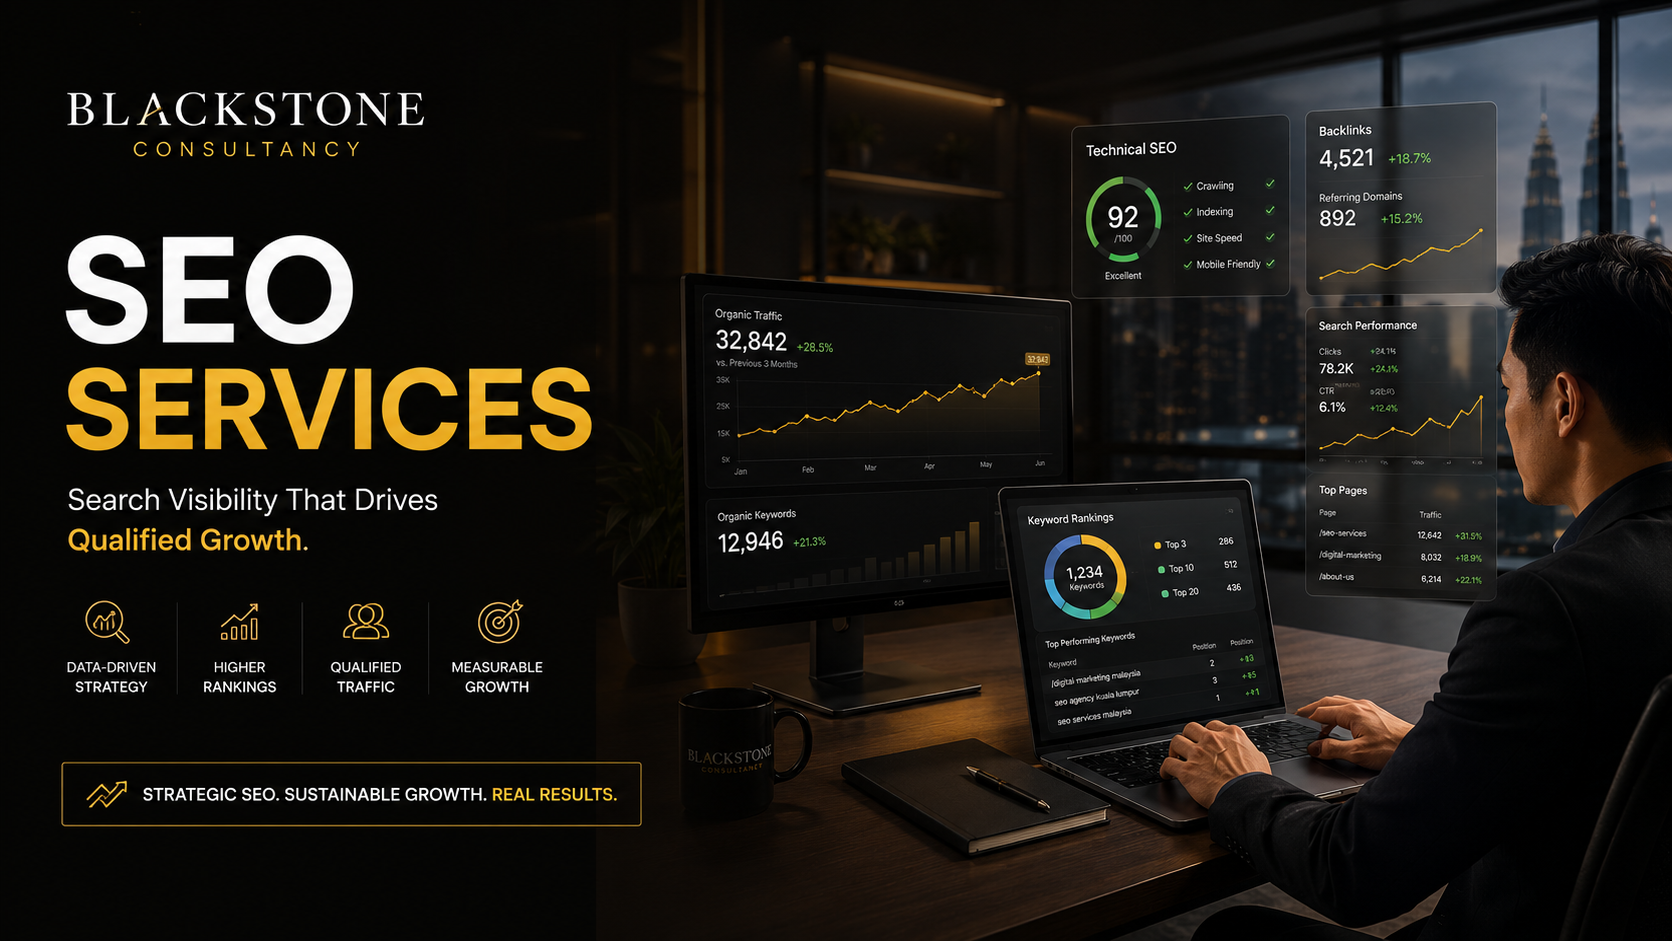
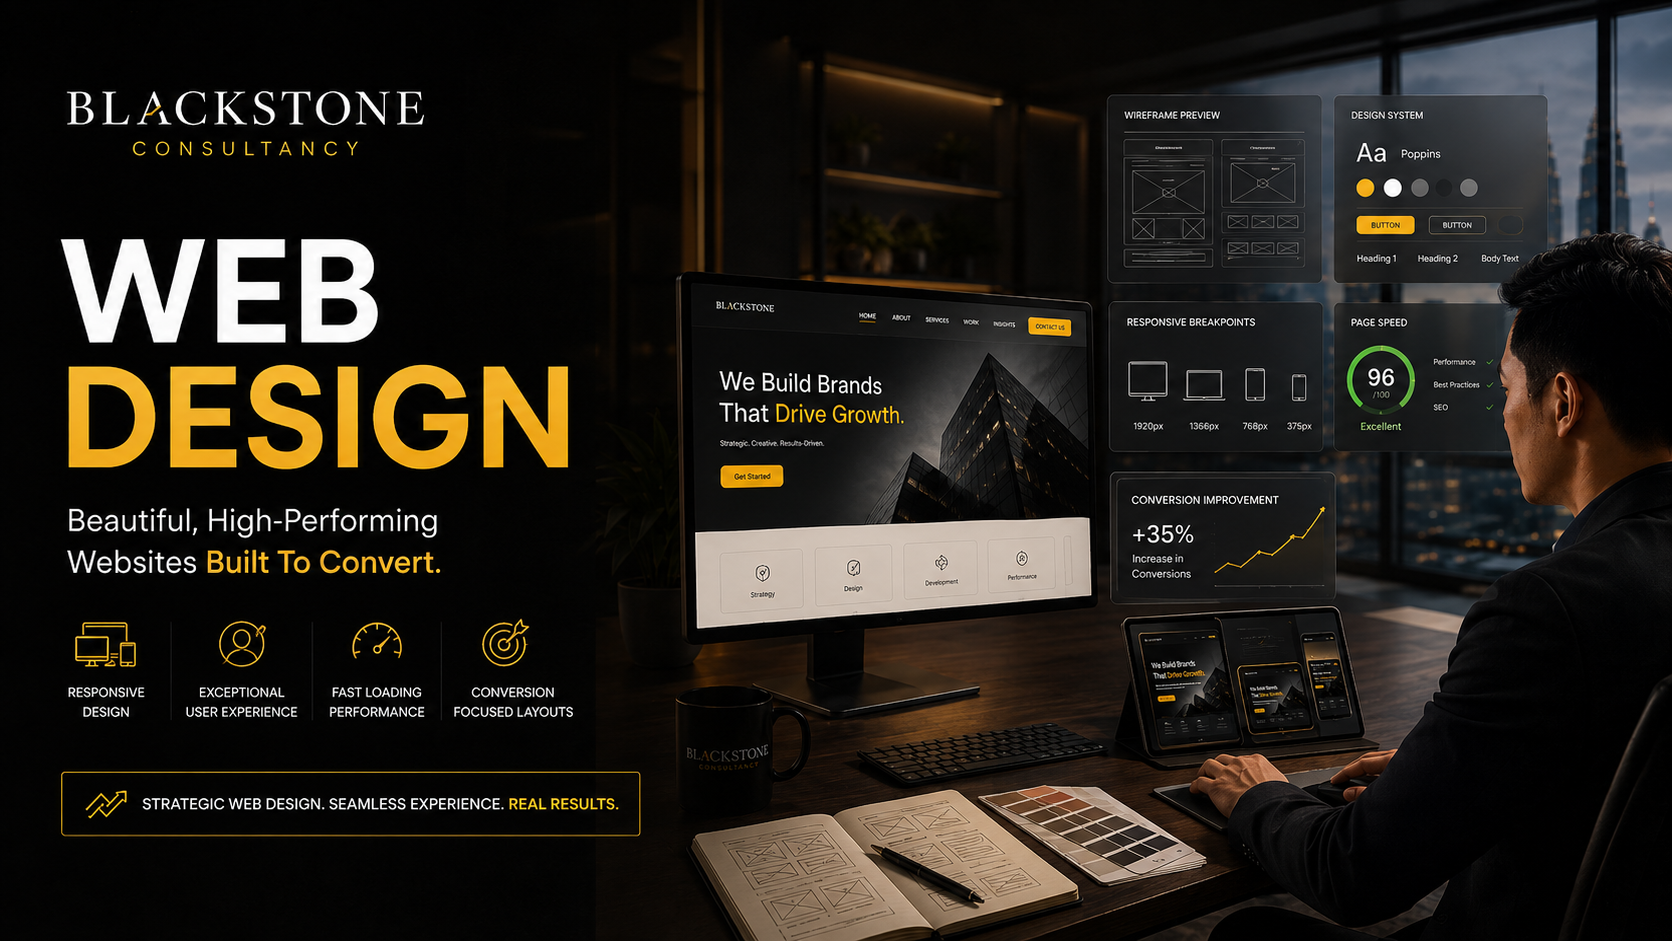
Blackstone AI partnered with Eyonic to execute a complete digital overhaul. We built a modern, high-performance website optimized for local SEO, targeting high-intent keywords related to security services. Simultaneously, we developed a robust social media content strategy to educate the market and build brand authority. The result was a massive surge in organic traffic, a significant increase in qualified leads, and a dominant position in local search rankings.
The Challenge: Invisible in a High-Demand Market
The security services market in Malaysia is highly competitive. When businesses or homeowners need CCTV or door access systems, their first step is almost always a Google search. Eyonic was missing out on this crucial discovery phase due to several factors:
1. Outdated, Non-Optimized Website
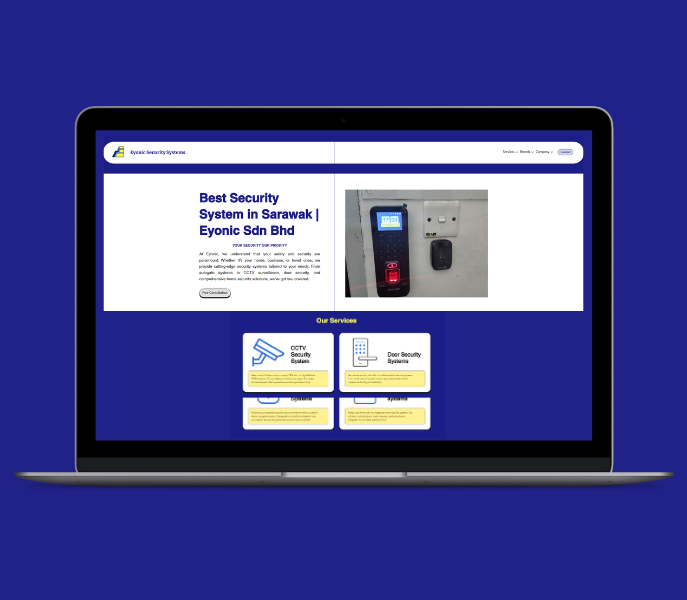
Their existing website was slow, not mobile-responsive, and lacked clear service pages. More importantly, it was entirely invisible to search engines for critical keywords like "CCTV installation Malaysia" or "door access control systems."
2. Lack of Educational Content
Security technology can be complex. Potential customers often have questions about IP vs. Analog cameras, biometric access, or cloud storage. Eyonic had no content addressing these pain points, missing the opportunity to establish themselves as industry experts.
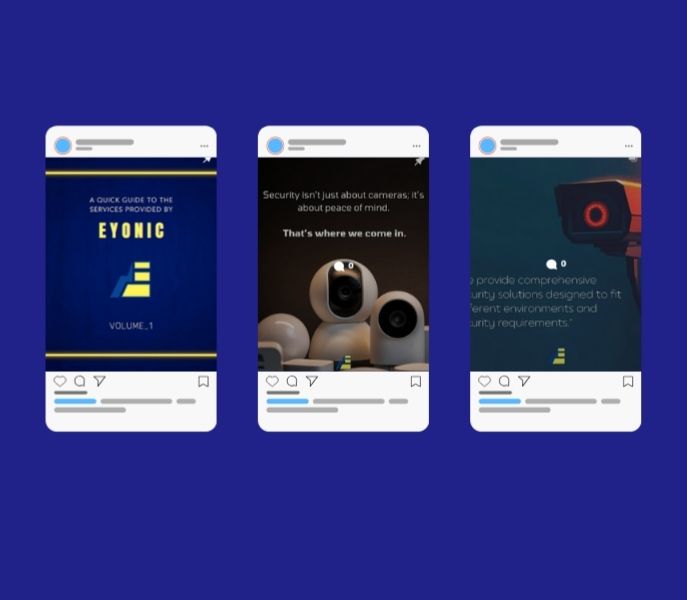
3. Inconsistent Social Media Presence
Their social media channels were largely inactive, occasionally posting generic product photos without context or engagement strategy, failing to build trust or showcase their successful installations.
📊 Lead Source Distribution Before Optimization
The Solution: The Digital Fortress Strategy
Blackstone AI implemented a two-pronged "Digital Fortress" strategy: building a technically sound, SEO-optimized website as the foundation, and fueling it with a dynamic social media and content engine.
| Phase | Action Taken | Key Deliverables |
|---|---|---|
| 1. Website Architecture & Design | Built a fast, mobile-first website with clear user journeys for both B2B (corporate) and B2C (residential) clients. | Custom WordPress build, dedicated service pages (CCTV, Alarms, Access Control), optimized site speed. |
| 2. Comprehensive Local SEO | Conducted deep keyword research and optimized all on-page elements, focusing on local search intent. | Meta tags optimization, schema markup for local business, Google Business Profile optimization. |
| 3. Content Marketing Engine | Developed a blog strategy focusing on "How-To" guides, security tips, and technology comparisons. | Monthly SEO-optimized blog posts, case studies of successful installations, FAQ sections. |
| 4. Social Media Authority Building | Revamped social channels (LinkedIn for B2B, Facebook/Instagram for B2C) with educational and proof-of-work content. | Video walkthroughs of installations, client testimonials, security tips infographics. |
Key SEO & Content Tactics
The success of the campaign relied on highly targeted tactics:
- Service-Specific Landing Pages: Instead of grouping all services, we created deep, informative pages for each specific service (e.g., a dedicated page for "Biometric Door Access Systems" rather than just "Security").
- "Proof of Work" Content: We heavily utilized before-and-after photos and video walkthroughs of complex installations on social media to build immediate trust and demonstrate technical competence.
- Local SEO Dominance: We optimized their Google Business Profile and ensured consistent NAP (Name, Address, Phone) citations across local directories to capture "near me" searches.
📈 Organic Traffic Growth (6 Months)
The Results: Dominating the Search Landscape
The comprehensive digital overhaul by Blackstone AI transformed Eyonic Sdn Bhd from an offline player into a dominant online force in the Malaysian security sector.
Surge in Organic Visibility
Within six months, organic traffic to the website increased by 315%. Eyonic secured Top 3 rankings on Google for highly competitive, high-intent keywords, ensuring they were visible exactly when potential clients were actively looking to buy.
High-Quality Lead Generation
The combination of targeted SEO and clear website user journeys resulted in a 180% increase in qualified leads. The leads generated through the website had a significantly higher closing rate because the educational content had already pre-qualified and built trust with the prospects.
Established Brand Authority
The consistent, high-quality social media content positioned Eyonic as thought leaders in the security space. Their LinkedIn presence, in particular, opened doors to lucrative B2B contracts and partnerships that were previously inaccessible.
🎯 Keyword Ranking Improvements
Conclusion: Building a Sustainable Digital Asset
The transformation of Eyonic Sdn Bhd highlights the critical importance of a strong, SEO-driven digital foundation for service-based businesses. By partnering with Blackstone AI, Eyonic didn't just get a new website; they acquired a sustainable, lead-generating digital asset.
This case study demonstrates that in technical industries like security, combining deep SEO expertise with educational, authority-building content is the most effective strategy for capturing market share and driving long-term business growth.